$ vmware-toolbox-cmd stat raw
|
■
|
session – the current session. This changes infrequently. Session changes can cause discontinuities.
|
|
■
|
host – information about the current hypervisor and hardware the virtual machine is running on.
|
|
■
|
resources – the CPU and memory usage of this virtual machine.
|
|
■
|
vscsi <name> – storage statistics for a specific virtual disk, where <name> is the internal name in the virtual machine’s configuration file. The library does not aggregate storage statistics across disks.
|
|
■
|
vnet <Ethernet Address> – network statistics for a specific virtual NIC, where <Ethernet Address> is the MAC address currently programmed into the virtual NIC. The library does not aggregate network statistics across NICs.
|
$ vmware-toolbox-cmd stat raw text session
|
■
|
session – a cryptographically strong random number indicating the current session. Expected to contain at least 63 bits of entropy. Changes with every session.
|
|
■
|
uptime – microseconds since the last session change, as measured by the host.
|
|
■
|
version – string representation of the hypervisor version. Not expected to be parsed. A guest OS should never change its behavior based on the hypervisor version or build number.
|
|
■
|
provider – string representing the provider. Set by the ExtraConfig tools.guestlib.stat.provider and intended for use by vSphere providers such as vCloud Air. Opaque contents defined by the provider.
|
|
■
|
uuid.bios – the virtual machine’s SMBIOS UUID, cached at boot time. VMware maintains the SMBIOS UUID as a component of guest licensing; migrating a VM retains the same UUID while cloning a VM generates a different UUID. The algorithm to generate a new UUID varies from release to release.
The vSphere API permits changing a VM’s UUID. Although vSphere prevents unintentional duplication of UUID, it allows deliberate UUID duplication, because legitimate workflows (such as lab environments) often require duplicated UUIDs. |
In the next example, only the first two values are provided by default. A virtual machine with ExtraConfig tools.guestlib.enableHostInfo = TRUE (a non-default setting) supplies the remaining values.
$ vmware-toolbox-cmd stat raw text host
|
■
|
host.cpu.processorMHz – nominal processor speed. Other metrics, such as vm.cpu.used below, are normalized to this speed.
|
|
■
|
host.cpu.coresPerPkg – actual cores per socket, not including hyperthreads. Useful for determining cache effects and other aspects of socket sharing. Information is also available with CPUID instruction. Note that vSphere does not implement virtual hyperthreads.
|
|
■
|
host.cpu.packages – number of CPU sockets on the host (non-default).
|
|
■
|
host.cpu.cores – number of cores on the host across all sockets, not including hyperthreads (non-default).
|
|
■
|
host.cpu.threads – number of logical CPUs on the host across all sockets, including hyperthreads (non-default).
|
|
■
|
host.dmi.product – “product” field in the host SMBIOS data (non-default).
|
|
■
|
host.dmi.vendor – “vendor” field in the host SMBIOS data (non-default).
|
Host information (dmi.product and dmi.vendor) and total capacity are hidden by default, because this information is considered sensitive and not relevant to virtual machine execution. VMware discourages use of such information, but permits it to be made available to help with support.
For implementation reasons, a virtual machine tracks CPU and memory resources slightly differently. CPU resources, including NUMA, indicate virtualization overhead, shown with vm. prefix. Memory resources are broken out by guest memory, shown with guest. prefix, and by overhead memory, with ovhd. prefix. Future implementations may add additional metrics.
$ vmware-toolbox-cmd stat raw text resources
|
■
|
vm.cpu.reserved – (static) MHz of current CPU type reserved. Covers all virtual CPU plus overheads, so for example a 2 virtual CPU machine would need 2x host.cpu.processorMHz to be fully reserved. Overheads are insignificant except during transient conditions such as taking a backup snapshot or during a vMotion. Default 0.
|
|
■
|
vm.cpu.limit – (static) MHz that the virtual machine will not exceed. Default –1 means unlimited.
|
|
■
|
vm.cpu.used – (cumulative) microseconds of CPU time used by this virtual machine. Equivalent to esxtop %USED. See Comparison to esxtop for details.
|
|
■
|
vm.cpu.contention.cpu = (cumulative) CPU time the virtual machine could have run, but did not run due to CPU contention. This metric includes time losses due to hypervisor factors, such as overcommit. Specific sources of contention vary widely from release to release. See Comparison to esxtop for details about calculating CPU contention.
|
|
■
|
vm.cpu.contention.mem – (cumulative) CPU time the virtual machine could have run, but did not run due to memory contention. This metric includes losses due to swapping. Equivalent to esxtop %SWPWT.
|
|
■
|
vm.numa.local – (instantaneous) KB of memory currently local, sum across the VM’s NUMA nodes.
|
|
■
|
vm.numa.remote – (instantaneous) KB of memory currently remote, sum across the VM’s NUMA nodes.
|
|
■
|
guest.mem.reserved – (static) KB of memory reserved for the guest OS. This indicates memory that will never be ballooned or swapped. Default is 0.
|
|
■
|
guest.mem.limit – (static) KB of memory the guest must operate within. Default –1 means unlimited.
|
|
■
|
guest.mem.mapped – (instantaneous) KB of memory currently mapped into the guest; that is, memory the guest can access with zero read latency. This metric represents memory use from a guest perspective.
|
|
■
|
guest.mem.consumed – (instantaneous) KB of memory used to provide current mapped memory. This might be lower than mapped due to ballooning, memory sharing, or future optimizations. This metric represents memory use from a host perspective. The difference between guest.mem.mapped and guest.mem.consumed is additional memory made available due to hypervisor optimizations.
|
|
■
|
guest.mem.swapped – (instantaneous) KB of memory swapped to disk. A fully reserved virtual machine should never see memory swapped out in steady-state usage. Transient conditions, such as resume from memory-included snapshot, might show some swap usage.
|
|
■
|
guest.mem.ballooned – (instantaneous) KB of memory deliberately copied on write (COWed) to zero in the guest OS, to reduce memory usage.
|
|
■
|
guest.mem.swapIn – (cumulative) KB of memory swapped in for the current session.
|
|
■
|
guest.mem.swapOut – (cumulative) KB of memory swapped out for the current session.
|
|
■
|
ovhd.mem.swapped – (instantaneous) KB of overhead memory currently swapped.
|
|
■
|
ovhd.mem.swapIn – (cumulative) KB of overhead memory swapped in for the current session.
|
|
■
|
ovhd.mem.swapOut – (cumulative) KB of overhead memory swapped out for the current session.
|
|
■
|
vm.cpu.contention.mem – usually < 1%, anything greater indicates memory overcommit.
|
|
■
|
vm.cpu.contention.cpu – < 5% of incremental time during undercommit, < 50% of incremental time at normal levels of overcommit (vSphere is tuned to perform best when somewhat overcommitted).
|
|
■
|
vm.numa.local – Expected to match guest.memory.mapped. Transient conditions such as NUMA rebalance can cause this to temporarily decrease, then return to normal as memory is migrated.
|
|
■
|
vm.numa.remote – Expected to be approximately zero in non-overcommitted scenarios.
|
|
■
|
guest.mem.mapped – Expected to equal configured guest memory; might be smaller if virtual machine has yet to access all its memory.
|
|
■
|
guest.mem.consumed – Expected to be approximately equal to configured guest memory; will be smaller if host memory is overcommitted.
|
|
■
|
guest.mem.swapped – Expected to be zero. Non-zero indicates non-graceful memory overcommit.
|
|
■
|
guest.mem.ballooned – Expected to be zero. Non-zero indicates graceful memory overcommit.
|
|
■
|
ovhd.mem.swapped – Expected to be zero. Non-zero indicates memory overcommit.
|
|
■
|
|
■
|
|
■
|
configured memory size = vm.numa.local + vm.numa.remote
(another formula for arriving at the same statistic above) |
|
■
|
Individual reasons for lack of vCPU progress are available to vSphere administrators (using either esxtop or the vSphere API) but are hidden from the guest OS to preserve isolation between the virtual machine and the configuration of the infrastructure it runs upon. The guest OS sees only an aggregate metric.
|
■
|
vm.cpu.used is equivalent to the esxtop statistic %USED for a virtual machine.
|
|
■
|
vm.cpu.contention.cpu is equivalent to
(%RDY – %MLMTD) + %MLMTD + %CSTP + %WAIT + (%RUN – %USED) |
|
■
|
vm.cpu.contention.mem is equivalent to %SWPWT.
|
The host.cpu.processorMHz metric (in the host section) reports a nominal speed, and the virtual machine CPU metrics are normalized to the processorMHz metric. Actual processor speed might be higher or lower depending on host power management.
A virtual machine can see vm.cpu.used exceed wall clock time due to Turbo Boost, or can see vm.cpu.used lag wall clock time due to power saving modes used in conjunction with idle guests. Actual processor speed is not available to the guest OS, but is expected to be close to nominal clock speed when the guest OS is active. See http://www.vmware.com/files/pdf/techpaper/hpm-perf-vsphere55.pdf for more information about vSphere host power management.
The vm.cpu.contention.cpu metric is similar to “stolen time” returned by VMGuestLib_GetCpuStolenMs (see Accessor Functions for Virtual Machine Data), except “stolen time” excludes time the virtual machine did not run due to configured resource limits. Comparing this value to esxtop requires denormalizing the contention ratio, because esxtop reports a sum of percentages across VCPUs. So:
Due to sample aliasing where in-guest time samples and esxtop time samples do not occur simultaneously, instantaneous esxtop values will not match instantaneous in-guest statistics. Longer time samples or averaging values collected over time will produce more comparable results.
CPU utilization across all virtual machines illustrates these concepts.
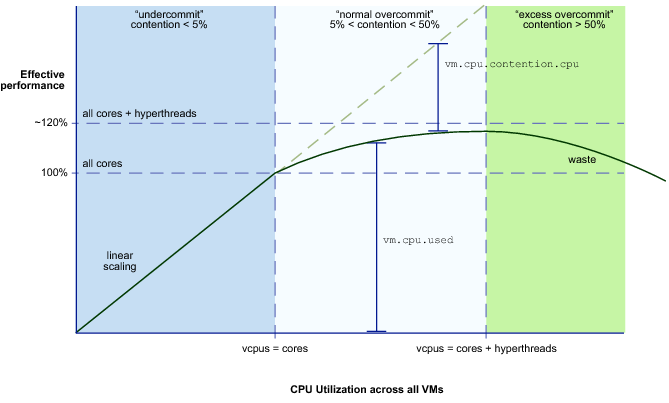
VMware best practices describe the available CPU capacity of an ESXi host as equal to the number of cores (not including hyperthreads). A 16 core host with 2.0GHz processors has 16 cores * 2000 MHz/core = 32000 MHz available compute capacity. When actual usage is below that calculated capacity, the hypervisor is considered “under committed” – the hypervisor is scaling linearly with load applied, and is wasting capacity.
$ vmware-toolbox-cmd stat raw text vscsi scsi0:0
|
■
|
num.reads – read commands.
|
|
■
|
num.writes – write commands.
|
|
■
|
size.reads – bytes read.
|
|
■
|
size.writes – bytes written.
|
|
■
|
latency.reads – microseconds of all read commands.
|
|
■
|
latency.writes – microseconds of all write commands.
|
(num.reads @ TimeNow) – (num.reads @ Time10sec)
–––––––––––––––––––––––––––––––––––––––––––––
TimeNow – Time10sec
–––––––––––––––––––––––––––––––––––––––––––––
TimeNow – Time10sec
(latency.reads @ TimeNow) – (latency.reads @ Time10sec)
––––––––––––––––––––––––––––––––––––––––––––––––––––––
(num.reads @ TimeNow) – (num.reads @ Time10sec)
––––––––––––––––––––––––––––––––––––––––––––––––––––––
(num.reads @ TimeNow) – (num.reads @ Time10sec)
Reservation and limit are supported on DVS (Distributed Virtual Switch) or “opaque” (NSX) switch types only; they are not supported on the default VSS switch type. Between reservation and limit, bandwidth is allocated on a share-based system, which is not meaningful to expose to a guest OS.
$ vmware-toolbox-cmd stat raw text vnet 00:0c:29:1e:23:f3
|
■
|
num.tx – number of packets transmitted.
|
|
■
|
size.tx – bytes transmitted.
|
|
■
|
num.rx – number of packets received.
|
|
■
|
size.rx – bytes received.
|
|
■
|
reservation – guaranteed minimum bandwidth for this vNIC.
|
|
■
|
limit – maximum bandwidth allowed for this vNIC.
|