vSphere Performance Data Collection
In a vSphere environment, virtual and physical components generate performance data. To track the use of resources, ESXi Servers perform real-time data collection and vCenter Servers store the data in the vCenter database. vCenter Servers also store a historical rollup of the data according to defined performance intervals.
- Real-time data collection – An ESXi Server collects data for each performance counter every 20 seconds and maintains that data for one hour.
- Historical data rollup – A vCenter Server collects data from all of the hosts that the vCenter Server manages. The PerformanceManager defines performance intervals that specify time periods for performance data rollup, a methodology for combining data values. The server stores the rolled up performance counter data in the vCenter database.
The following figure represents vSphere performance data collection and retrieval.
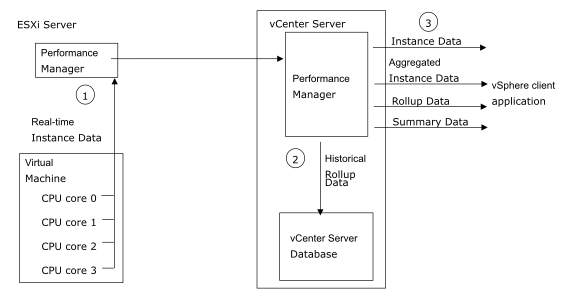
- ESXi Servers sample performance counter instances every 20 seconds and maintain the real-time instance data for one hour. For example, the figure shows collection of CPU statistics for four CPU cores.
- The vCenter Server retrieves and stores data from the servers that it manages. The Server produces rollup data according to the settings of the historical intervals.
- vSphere client applications can retrieve real-time instance data, aggregated instance data, historical rollup data, and summary data.
The following table defines terms that are used to describe vSphere performance management.
| Term | Definition |
|---|---|
| performance providers | Performance providers include managed entities, such as hosts, virtual machines, compute resources, resource pools, datastores, and networks. |
| performance counter | Unit of statistical data collected on a vSphere server. For example, a vCenter server collects the average CPU utilization for hosts, virtual machines and clusters (the counter cpu.usage.average). |
| counter ID | System-generated identifier for a performance counter. |
| instance | An identifier derived from device configuration names. Examples of counter instances are the name of a virtual Ethernet adapter such as “vmnic0:”, or a number that identifies a CPU core, such as 0, 1, 2, or 3. Performance data is retrieved as specific instances of performance counters. |
| instance data | Performance data collected at 20-second intervals. |
| metric ID | Combination of a
counter ID and an instance. You use metric IDs –
PerfMetricId objects –
when you construct a performance query specification to identify the data to be
collected.
There are two system-defined instances that you can use to specify aggregate retrieval. See the description of aggregate performance data below.
The vSphere Server returns metric IDs embedded in the data objects that it returns as a response to performance queries. |
| performance interval | Data object (PerfInterval) which defines the time interval
between collection events, the
collection level, and the time period that the data
will be stored on the Server.
|
| collection level | Number between one and four that is assigned to a performance interval (PerformanceManager.historicalInterval[].level). The interval collection level corresponds to the level specified for individual performance counters (PerfCounterInfo.level). A vCenter Server uses a performance interval to perform performance data aggregation, using data for the counters with levels that match the performance interval collection level. |
| rollup type | Methodology for producing a single value from a set of statistical values (PerformanceManager.perfCounter[].rollupType). Examples of rollup types are average, latest, and summation. |
| aggregate performance data | A single value that represents a set of instance data values collected for a performance counter. The single value is derived using one of the rollup types. |