|
■
|
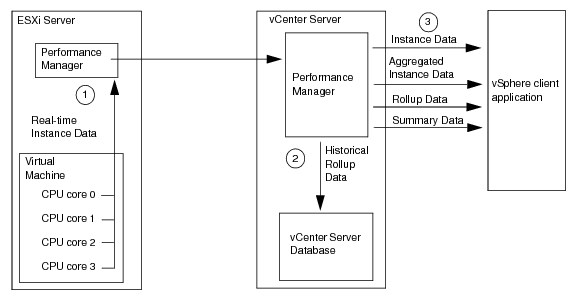
Historical data rollup – A vCenter Server collects data from all of the hosts that the vCenter Server manages. The PerformanceManager defines performance intervals that specify time periods for performance data rollup, a methodology for combining data values. The server stores the rolled up performance counter data in the vCenter database.
|
|
Combination of a counter ID and an instance. You use metric IDs – PerfMetricId objects – when you construct a performance query specification to identify the data to be collected.
There are two system-defined instances that you can use to specify aggregate retrieval. See the description of aggregate performance data below.
|
|||||
|
Data object (PerfInterval) which defines the time interval between collection events, the collection level, and the time period that the data will be stored on the Server.
|
|||||
|
Number between one and four that is assigned to a performance interval (PerformanceManager.historicalInterval[].level). The interval collection level corresponds to the level specified for individual performance counters (PerfCounterInfo.level). A vCenter Server uses a performance interval to perform performance data aggregation, using data for the counters with levels that match the performance interval collection level.
|
|||||
|
Methodology for producing a single value from a set of statistical values (PerformanceManager.perfCounter[].rollupType). Examples of rollup types are average, latest, and summation.
|
|||||
|
A single value that represents a set of instance data values collected for a performance counter. The single value is derived using one of the rollup types.
|