To retrieve collected data, your client application creates a query specification and passes the specification to a performance query method. The query specification is composed of one or more PerfQuerySpec objects. Each object identifies the following:
|
■
|
Performance provider – managed entity for which the Server will return performance data (PerfQuerySpec.entity).
|
|
■
|
Performance counters – PerfMetricId objects that identify performance counter instances (PerfQuerySpec.metricId).
|
|
■
|
Performance interval – the sampling period that defines the data rollup (PerfQuerySpec.intervalId).
|
|
■
|
Amount of data to be returned – start and end times (PerfQuerySpec.startTime, PerfQuerySpec.endTime) and maximum number of values (PerfQuerySpec.maxSample) to limit the amount of data to be returned.
|
|
■
|
Output data format (PerfQuerySpec.format) – one of two kinds:
|
The combination of the entity and metricID properties determine the set of counters for which the server will return performance data. The combination of the interval, startTime, endTime properties produce instance, aggregated instance, rollup, or summarized data. The following table summarizes the different classifications of performance data that you can retrieve from a vCenter Server.
|
ESXi Servers sample performance data every 20 seconds. 20-second interval data is called instance data or real-time data. To retrieve instance data, specify a value of 20 seconds for the PerfQuerySpec.intervalId property.
|
|||||
|
Aggregated Instance
|
A vSphere client can retrieve aggregated instance data. To obtain aggregated instance data, specify the following PerfQuerySpec properties.
|
||||
|
The vCenter Server uses the historical intervals to rollup performance data from the servers that it manages. To retrieve historical performance data, specify the following PerfQuerySpec properties.
|
|||||
|
When you call the QueryPerf method and specify a performance interval (PerfQuerySpec.intervalId) that does not match one of the historical intervals (PerformanceManager.historicalInterval[].samplingPeriod), the Server will attempt to summarize the stored data for the specified interval. In this case, the Server may return values that are different from the values that were stored for the historical intervals.
|
The following code fragments are part of an example that uses the PerformanceManager.QueryPerf method to obtain performance statistics for a virtual machine. The example code in this section does not include server connection code and it does not show the code for obtaining the managed object reference for the virtual machine. See Client Applications for an example of server connection code.
|
■
|
disk.provisioned.LATEST – virtual machine storage capacity.
|
|
■
|
mem.granted.AVERAGE – amount of physical memory mapped for the virtual machine.
|
|
■
|
power.power.AVERAGE – current power usage.
|
The example creates a query specification (PerfQuerySpec) to identify the data to be retrieved, calls the QueryPerf method, and prints out the retrieved performance data and corresponding performance counter metadata. The following sections describe the basic steps involved in retrieving performance statistics.
|
■
|
Performance counters are represented by string names, for example disk.provisioned.LATEST or mem.granted.AVERAGE. A vSphere server tracks performance counters by using system-generated counter IDs. When you create a performance query, you use counter IDs to specify the statistics to be retrieved, so it is useful to map the names to IDs.
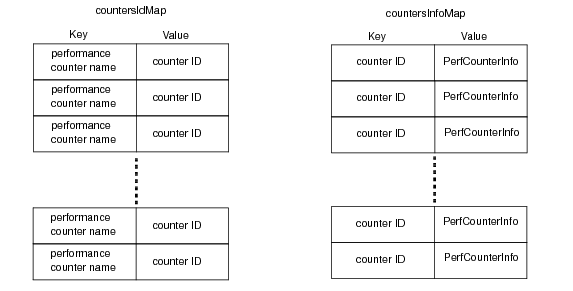
The example must specify counter IDs in the calls to QueryPerf, and it will use performance counter metadata when it prints information about the returned data. To obtain performance counter IDs and the corresponding performance counter metadata, the example creates two hash maps. This example maps the entire set of performance counters to support retrieval of any counter.
|
■
|
countersIdMap – Uses full counter names to index performance counter IDs. A full counter name is the combination of counter group, name, and rollup type. The example uses this map to obtain counter IDs when it builds the performance query specification.
|
|
■
|
countersInfoMap – Uses performance counter IDs to index PerformanceCounterInfo data objects. The example uses this map to obtain metadata when it prints the returned performance data.
|
private static HashMap<Integer, PerfCounterInfo> countersInfoMap =
new HashMap<Integer, PerfCounterInfo>();
new HashMap<Integer, PerfCounterInfo>();
The example uses the Property Collector to retrieve the array of performance counters (PerfCounterInfo) known to the vCenter Server (PerformanceManager.perfCounter[]). It then uses the data to create the maps. The code fragment uses the variable apiMethods, which is a VimPortType object that provides access to the vSphere API methods. For information about the VimPortType object, see Overview of a Java Sample Application.
|
1
|
Create an ObjectSpec to define the property collector context. This example specifies the Performance Manager.
|
|
2
|
Create a PropertySpec to identify the property to be retrieved. This example retrieves the perfCounter property, which is an array of PerfCounterInfo objects.
|
|
3
|
Create a PropertyFilterSpec for the call to the PropertyCollector. The PropertyFilterSpec creates the association between the ObjectSpec and PropertySpec for the operation.
|
|
4
|
Call the PropertyCollector.RetrievePropertiesEx method. This method blocks until the server returns the requested property data.
|
|
5
|
|
6
|
Cycle through the returned array and load the maps. The counter-name to counter-ID map uses a fully qualified counter name. The qualified name is a path consisting of counter group, counter name, and rollup type – group.counter.ROLLUP-TYPE. The rollup type must be coded in uppercase letters. Examples of qualified names are disk.provisioned.LATEST and mem.granted.AVERAGE.
|
* for example – power.power.AVERAGE.
The following code fragment calls the QueryPerf method to retrieve statistics. It performs these tasks:
|
1
|
Create a list of qualified performance counter names for retrieval. The name is a path consisting of group-name.counter-name.ROLLUP-TYPE, for example mem.granted.AVERAGE. The rollup type must be coded in uppercase letters to match the character case of the rollup type in the performance counter metadata (PerfCounterInfo.rollupType). See the vSphere API Reference for tables of available counters. The vSphere API Reference page for the PerformanceManager managed object contains links to the tables.
|
|
2
|
Create a list of PerfMetricId objects, one for each counter to be retrieved. The metric ID is a combination of the counter ID and the instance. To fill in the PerfMetricId properties, the example does the following:
|
|
■
|
Use the countersIdMap to translate a full counter name into a counter ID.
|
|
■
|
Specify an asterisk (*) for the PerfMetricId.instance property. The asterisk is the system-defined instance specification for combined instance and rollup retrieval.
|
|
4
|
Call the QueryPerf method.
|
The query methods return sampling information and performance data. The sampling information indicates the collection interval in seconds and the time that the data was collected. When you call performance query methods, you pass in query specifications (PerfQuerySpec) to identify the performance data to be retrieved. To indicate the format of the output data, specify either “normal” or “csv” for the PerfQuerySpec.format property.
The query methods return PerfEntityMetricBase objects which you must cast into the appropriate type that corresponds to the PerfQuerySpec.format value specified in the call to the method.
|
■
|
|
■
|
The QueryPerfComposite method returns a PerfCompositeMetric object, which contains PerfEntityMetricBase objects.
|
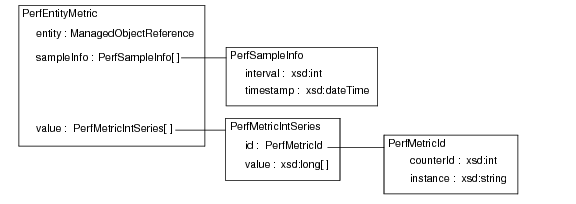
When you specify “normal” format, you must cast the returned PerfEntityMetricBase objects into PerfEntityMetric objects. Each PerfEntityMetric object contains the following properties:
|
■
|
entity – Reference to the performance provider.
|
|
■
|
sampleInfo – Array of sample information (PerfSampleInfo data objects), encoded as xsd:int and xsd:dateTime values.
|
|
■
|
value – Array of data values (PerfMetricIntSeries data objects). Each object in the array contains the following properties:
|
|
■
|
id – Performance metric ID that identifies the counter instance.
|
|
■
|
value – Array of integers that corresponds to the array of sample information (PerfEntityMetric.sampleInfo).
|
The following figure shows a representation of the data object hierarchy returned by the query methods for normal format.
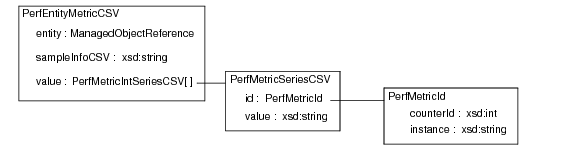
When you specify “csv” format, you must cast the returned PerfEntityMetricBase objects into PerfEntityMetricCSV objects. Both the sampling information and the collected data are encoded as comma-separated values suitable for display in tabular format.
The PerfEntityMetricCSV object contains the following properties:
|
■
|
entity – Reference to the performance provider.
|
|
■
|
sampleInfoCSV – String containing a set of interval and date-time values. The property contains string representations of PerfSampleInfo xsd:int and xsd:dateTime values. The string values are encoded in the following CSV format:
|
|
■
|
value – Array of data values (PerfMetricSeriesCSV data objects). Each object in the array contains the following properties:
|
|
■
|
id – Performance metric ID that identifies the counter instance.
|
|
■
|
value – Set of sample values in CSV format, corresponding to the list of sample information (PerfEntityMetricCSV.sampleInfoCSV).
|
The following figure shows a representation of the data object hierarchy returned by the query methods for CSV format.
The following code fragment prints out the returned performance data. This example uses CSV formatted data. The code fragment performs these tasks:
|
■
|
Loop through the list of PerfEntityMetricBase objects returned by the QueryPerf method (retrievedStats).
|
|
■
|
Cast the PerfEntityMetricBase object to a PerfEntityMetricCSV object to handle the CSV output specified in the PerfQuerySpec.
|
|
■
|
Retrieve the interval information (csvTimeInfoAboutStats). The sampleInfoCSV string (PerfEntityMetricCSV.sampleInfoCSV) is PerfSampleInfo data formatted as interval,time pairs separated by commas – interval-1,time-1,interval-2,time-2. The list of pairs embedded in the string corresponds to the list of sampled values (PerfEntityMetricCSV.value[]).
|
|
■
|
Loop through the sampled values (metricsValues).
|
|
■
|
Use the countersInfoMap to translate the counter ID returned in the PerfMetricSeriesCSV object into the corresponding PerfCounterInfo object.
|
|
■
|
Use the counter metadata to print out identifying information about the counter along with the returned sampled value for the counter.
|
The example described in the previous sections (Performance Counter Example (QueryPerf)) shows how to retrieve performance data for a single entity. When you design your application to retrieve performance data on a large scale, take the following information into consideration for more efficient processing.
|
■
|
Use CSV formatted output. CSV format provides a more compact representation of the output data which can save on meta-data overhead.
|
|
■
|
Using one QueryPerf method call per entity is not efficient.
|
|
■
|
Using a single call to QueryPerf to retrieve all of the performance data is not efficient.
|
|
■
|
As a general rule, specify between 10 and 50 entities in a single call to the QueryPerf method. This is a general recommendation because your system configuration may impose different constraints.
|
|
■
|
Do not retrieve statistics more frequently than they are refreshed. For example, when you retrieve 20-second interval data, the data will not change until the next 20-second data collection event.
|
|
■
|
Use QueryAvailablePerfMetric only when you intend to send a query for a specific counter using a specific performance interval. The method will return PerfMetricId objects that you can use for the query.
|
In all other cases, create the PerfMetricId objects for the query.
|
■
|
For the counterId property, use the counter IDs from the PerformanceManager counter list (PerformanceManager.perfCounter[].key).
|
|
■
|
For the instance property, specify an asterisk (“*”) to retrieve instance and aggregate data or a zero-length string (““) to retrieve aggregate data only.
|
The QueryPerf method can operate as a raw data feed that bypasses the vCenter database and instead retrieves performance data from an ESXi host. You can use a raw data feed to obtain real-time instance data associated with 20-second interval collection and aggregate data associated with the 5-minute intervals.
|
ESXi servers collect data for each performance counter every 20 seconds and maintain that data for an hour. When you specify a 20-second interval in the query specification for the QueryPerf method (PerfQuerySpec.intervalId), the method operates as a raw data feed. The Server ignores the historical interval collection levels and retrieves data for all of the requested counters from the ESXi servers. When you send a query for 20-second instance data, the server returns the most recent data collected for the 20-second interval. The server does not perform additional, unscheduled data collection to satisfy the query.
|
|||||
|
ESXi servers aggregate performance data according to the system-defined performance interval which specifies data collection every 300 seconds. To use a raw data feed for this data, specify the following PerfQuerySpec properties in the call to the QueryPerf method.
|
You can use this method to retrieve historical statistics; you can also use it as a raw data feed. For information about retrieving the raw data collected on ESXi servers, see Using the QueryPerf Method as a Raw Data Feed.
|
|||||||||
This method is designed for efficient client-server communications. QueryPerfComposite usually generates less network traffic than QueryPerf because it returns a large-grained object, a PerfCompositeMetric data object, that contains all the data.
|
You can obtain near real-time summary information about performance or utilization without using the PerformanceManager methods. vSphere servers maintain “quick stats” data objects for hosts (HostListSummaryQuickStats), virtual machines (VirtualMachineQuickStats), and resource pools (ResourcePoolQuickStats). For more information about these objects, see the vSphere API Reference.